3D Viewer
The NUVIEW Platform includes powerful tools for visualizing LiDAR point cloud and raster data in both 2D and 3D. Two dedicated views are available when working with this data: Mosaic view and 3D view.
Mosaic View
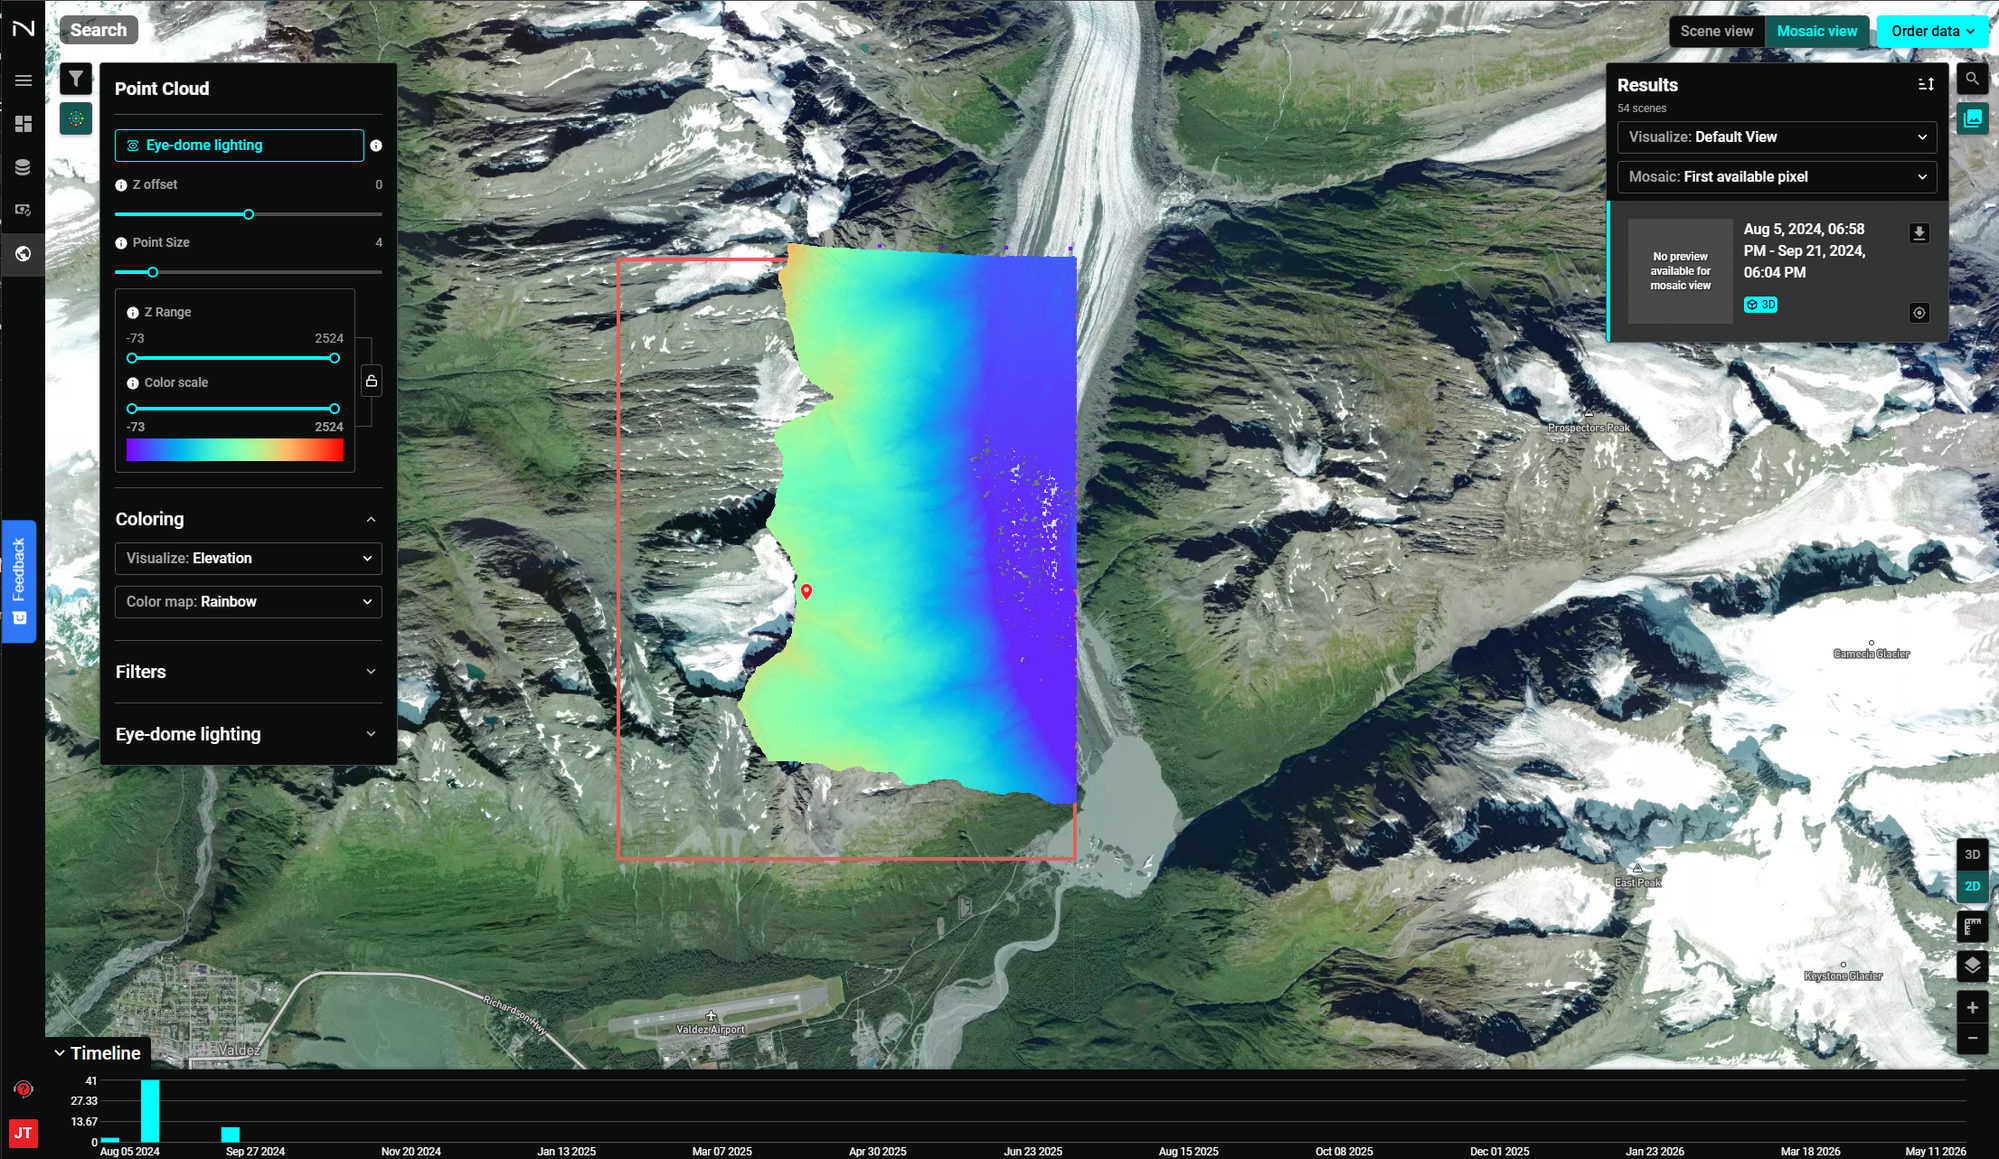
The Mosaic view displays LiDAR and raster data clipped and mosaicked to the size of your AOI boundary. This gives you a clean 2D representation of the data confined to your area of interest, making it easy to inspect coverage, validate data extent, and compare scenes from the timeline.
How Mosaicking Works
When multiple scenes cover your AOI, the platform mosaics them together automatically. The Mosaic dropdown in the Results panel controls how overlapping pixels are resolved:
- First available pixel — Uses the first valid pixel found across scenes (default)
Results Panel
The Results panel on the right shows all available scenes and lets you:
- Set the Visualize mode (Default View or others)
- Set the Mosaic method
- Browse individual scene results and their date ranges
- Click the 3D icon on the right-hand side of the map to jump to the 3D view for that scene
3D View
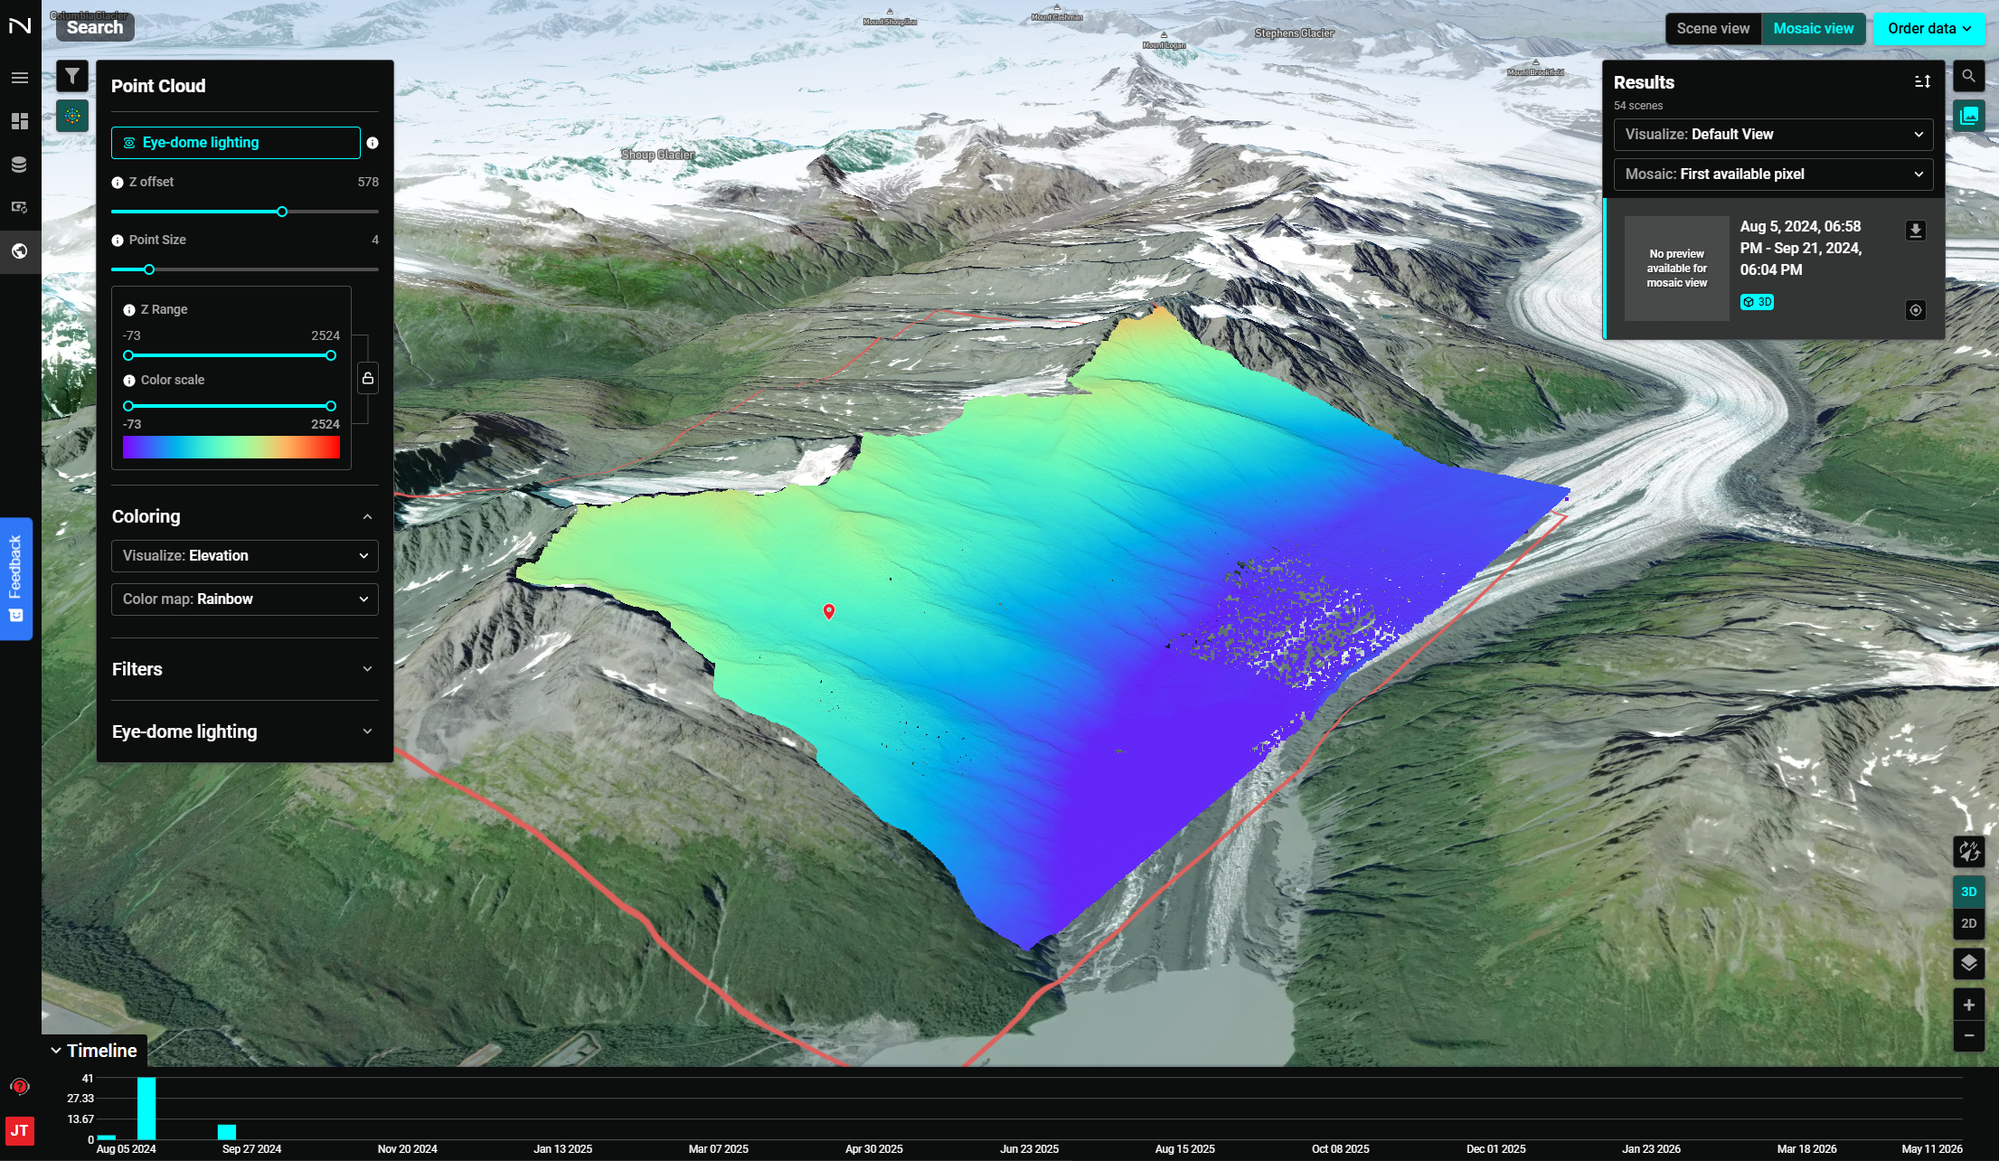
The 3D view renders LiDAR point cloud data in full three-dimensional perspective over terrain, enabling analysis of elevation, surface structure, and spatial relationships with full depth context.
Switching Between Views
Use the toggle buttons in the top-right corner:
- Scene view — Browse individual scenes without mosaicking
- Mosaic view — Display data mosaicked to your AOI
- 3D / 2D buttons (bottom-right) — Toggle between 3D perspective and 2D top-down
Navigating in 3D
- Rotate — Right-click and drag (or two-finger drag) to tilt and orbit
- Pan — Left-click and drag to move across the map
- Zoom — Scroll wheel or pinch to zoom
Point Cloud Settings
The Point Cloud panel on the left provides visualization controls:
| Control | Description |
|---|---|
| Eye-dome lighting | Enhances depth perception by shading based on surface normals |
| Z offset | Shifts the point cloud vertically for alignment |
| Point Size | Adjusts the rendered size of individual points |
| Z Range | Clips the display to a specific elevation band |
| Color scale | Sets the min/max values for the color ramp |
The Coloring section controls what attribute drives the color:
- Visualize — Select the attribute: Elevation, Intensity, Classification, RGB
- Color map — Choose a color ramp: Rainbow, Grayscale, etc.
LiDAR Classification View
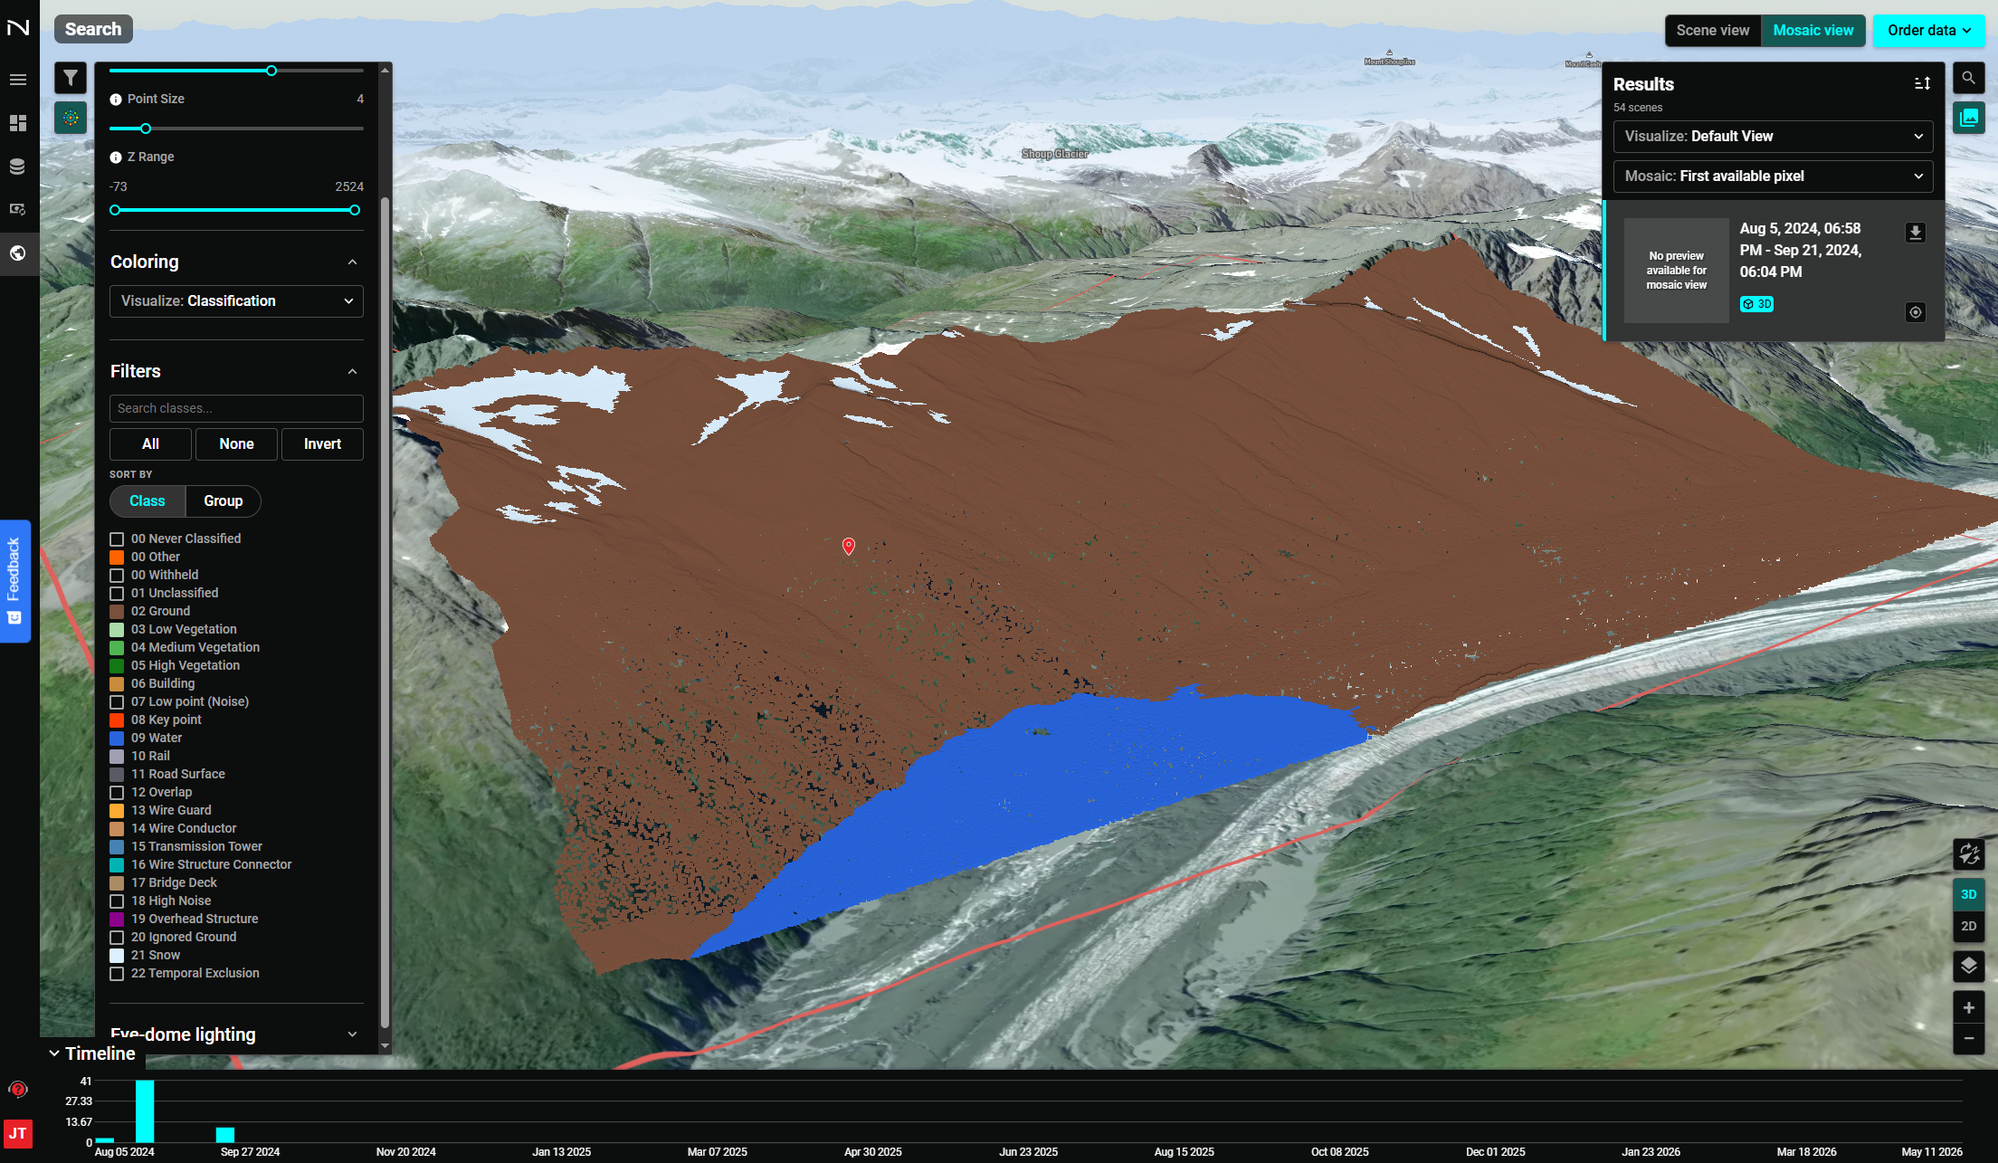
When Visualize: Classification is selected in the point cloud setting panel, the point cloud is colored by ASPRS LiDAR classification code. A Filters panel appears with a searchable list of all classification classes present in the data.
Filtering by Class
Use the class filter controls to show or hide specific point classes:
- All — Enable all classes
- None — Disable all classes
- Invert — Toggle the current selection
- Search classes — Type to filter the class list
- Sort by Class / Group — Organize the list by numeric code or semantic group
Supported Classification Codes
The platform supports the full ASPRS LiDAR classification standard:
| Code | Class |
|---|---|
| 00 | Never Classified |
| 01 | Unclassified |
| 02 | Ground |
| 03 | Low Vegetation |
| 04 | Medium Vegetation |
| 05 | High Vegetation |
| 06 | Building |
| 07 | Low point (Noise) |
| 08 | Key point |
| 09 | Water |
| 10 | Rail |
| 11 | Road Surface |
| 12 | Overlap |
| 13 | Wire Guard |
| 14 | Wire Conductor |
| 15 | Transmission Tower |
| 16 | Wire Structure Connector |
| 17 | Bridge Deck |
| 18 | High Noise |
| 19 | Overhead Structure |
| 20 | Ignored Ground |
| 21 | Snow |
| 22 | Temporal Exclusion |
Alaska Bare Earth Dataset
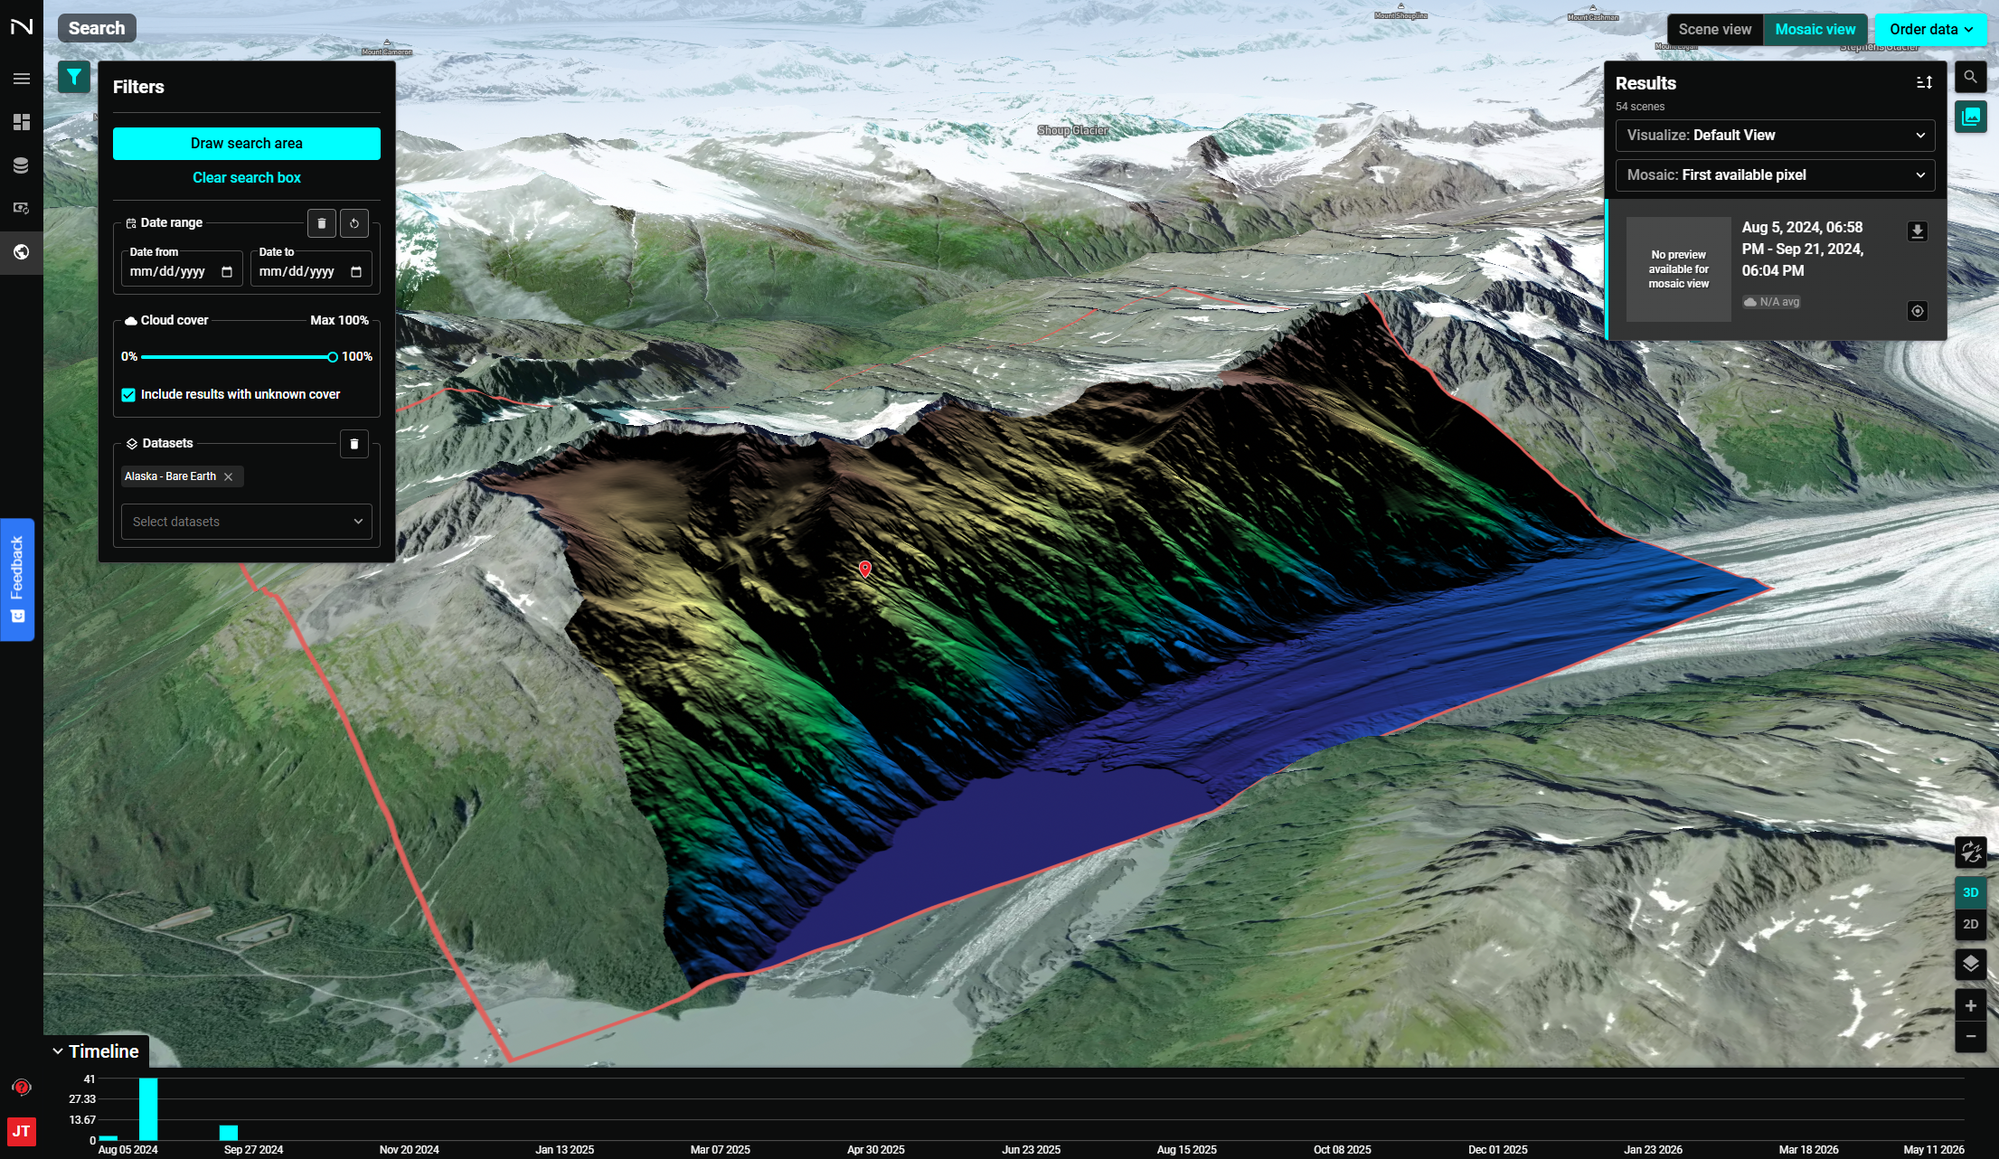
The Alaska - Bare Earth dataset is a statewide LiDAR-derived bare earth surface model available through the NUVIEW Platform. It renders as a high-resolution 3D terrain surface with full elevation coloring, revealing detailed landforms, river channels, glacial features, and infrastructure without vegetation or canopy obscuring the ground.
Accessing the Dataset
- Navigate to the Search section using the left sidebar.
- In the Filters panel, click Draw search area to define your AOI.
- Under Datasets, select Alaska - Bare Earth from the dropdown.
- Set a date range if needed, then browse results.
- Switch to Mosaic view and enable 3D to render the bare earth surface in three dimensions.
Use Cases
- Terrain analysis and slope mapping
- Flood plain and watershed delineation
- Infrastructure corridor planning
- Glacial change detection
- Vegetation removal for ground-truth analysis
Timeline
The Timeline at the bottom works the same as in other views — use it to step through available collection dates and compare bare earth surfaces over time.