Side-by-side comparison
The A|B Slider lets you compare two datasets side by side — dragging a vertical divider across the map to reveal differences between dates or dataset types. This works both within a Site and in the Search section, and supports any combination of satellite imagery, LiDAR, and raster products.
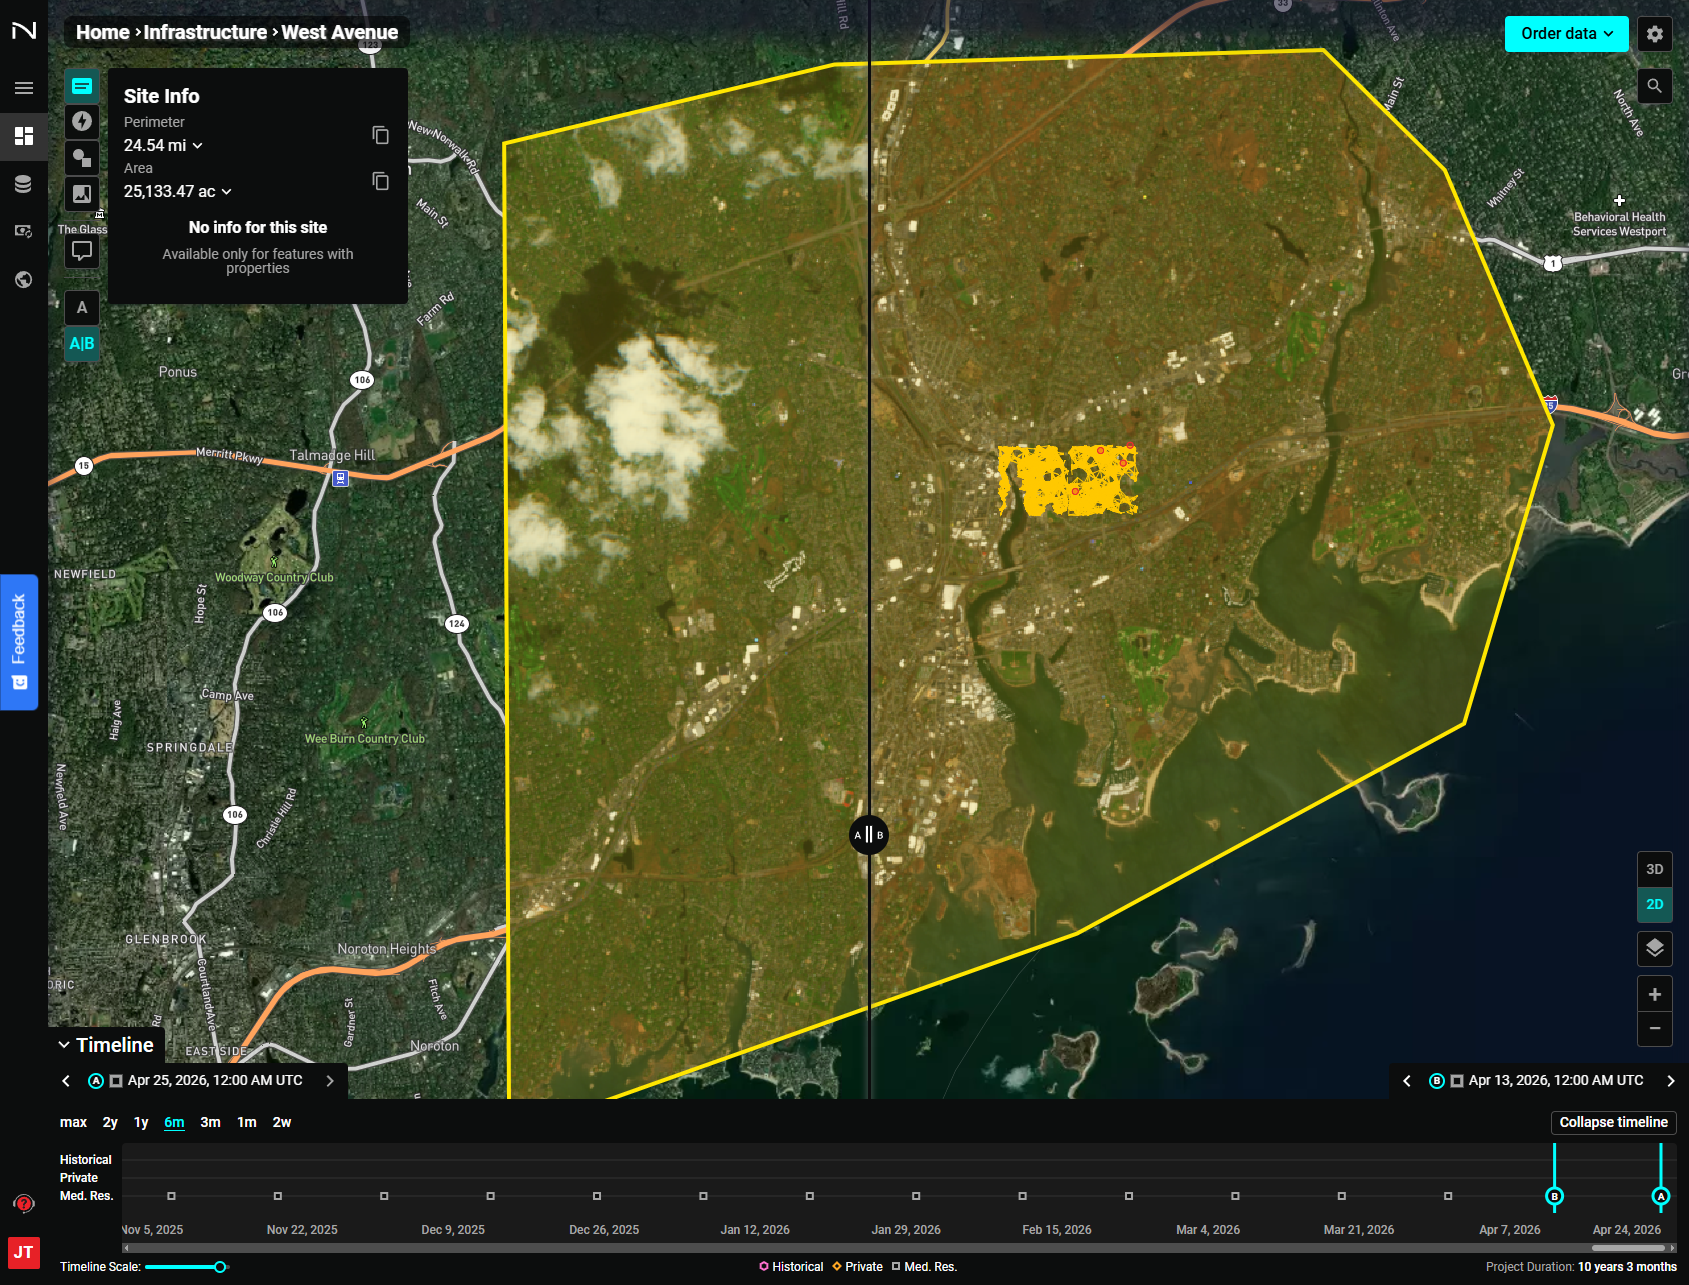
Enabling A|B View
Look for the A | A|B toggle in the upper-left area of the interface:
- A — Single image view (default)
- A|B — Split slider comparison view
Click A|B to activate. A vertical slider appears in the center of the map, dividing it into a left panel (Image A) and right panel (Image B).
Selecting Images to Compare
In a Site:
- Navigate to the first date using the Timeline — this becomes Image A (left).
- Navigate to the second date — this becomes Image B (right).
In Search (Scene view):
- In the Results panel, click the options icon on the first scene → Set as Image A.
- Click the options icon on the second scene → Set as Image B. A badge appears on the selected scene.
- The map switches to A|B view automatically.
Adjusting the Slider
Click and drag the center A|B handle left or right to reveal more of either image.
LiDAR vs Satellite Change Detection
The A|B Slider is especially powerful when comparing LiDAR elevation data against optical satellite imagery of the same area. In the example below, Image A is Sentinel-2 L2A satellite imagery and Image B is an Alaska LiDAR Point Cloud rendered with Elevation / Rainbow coloring:
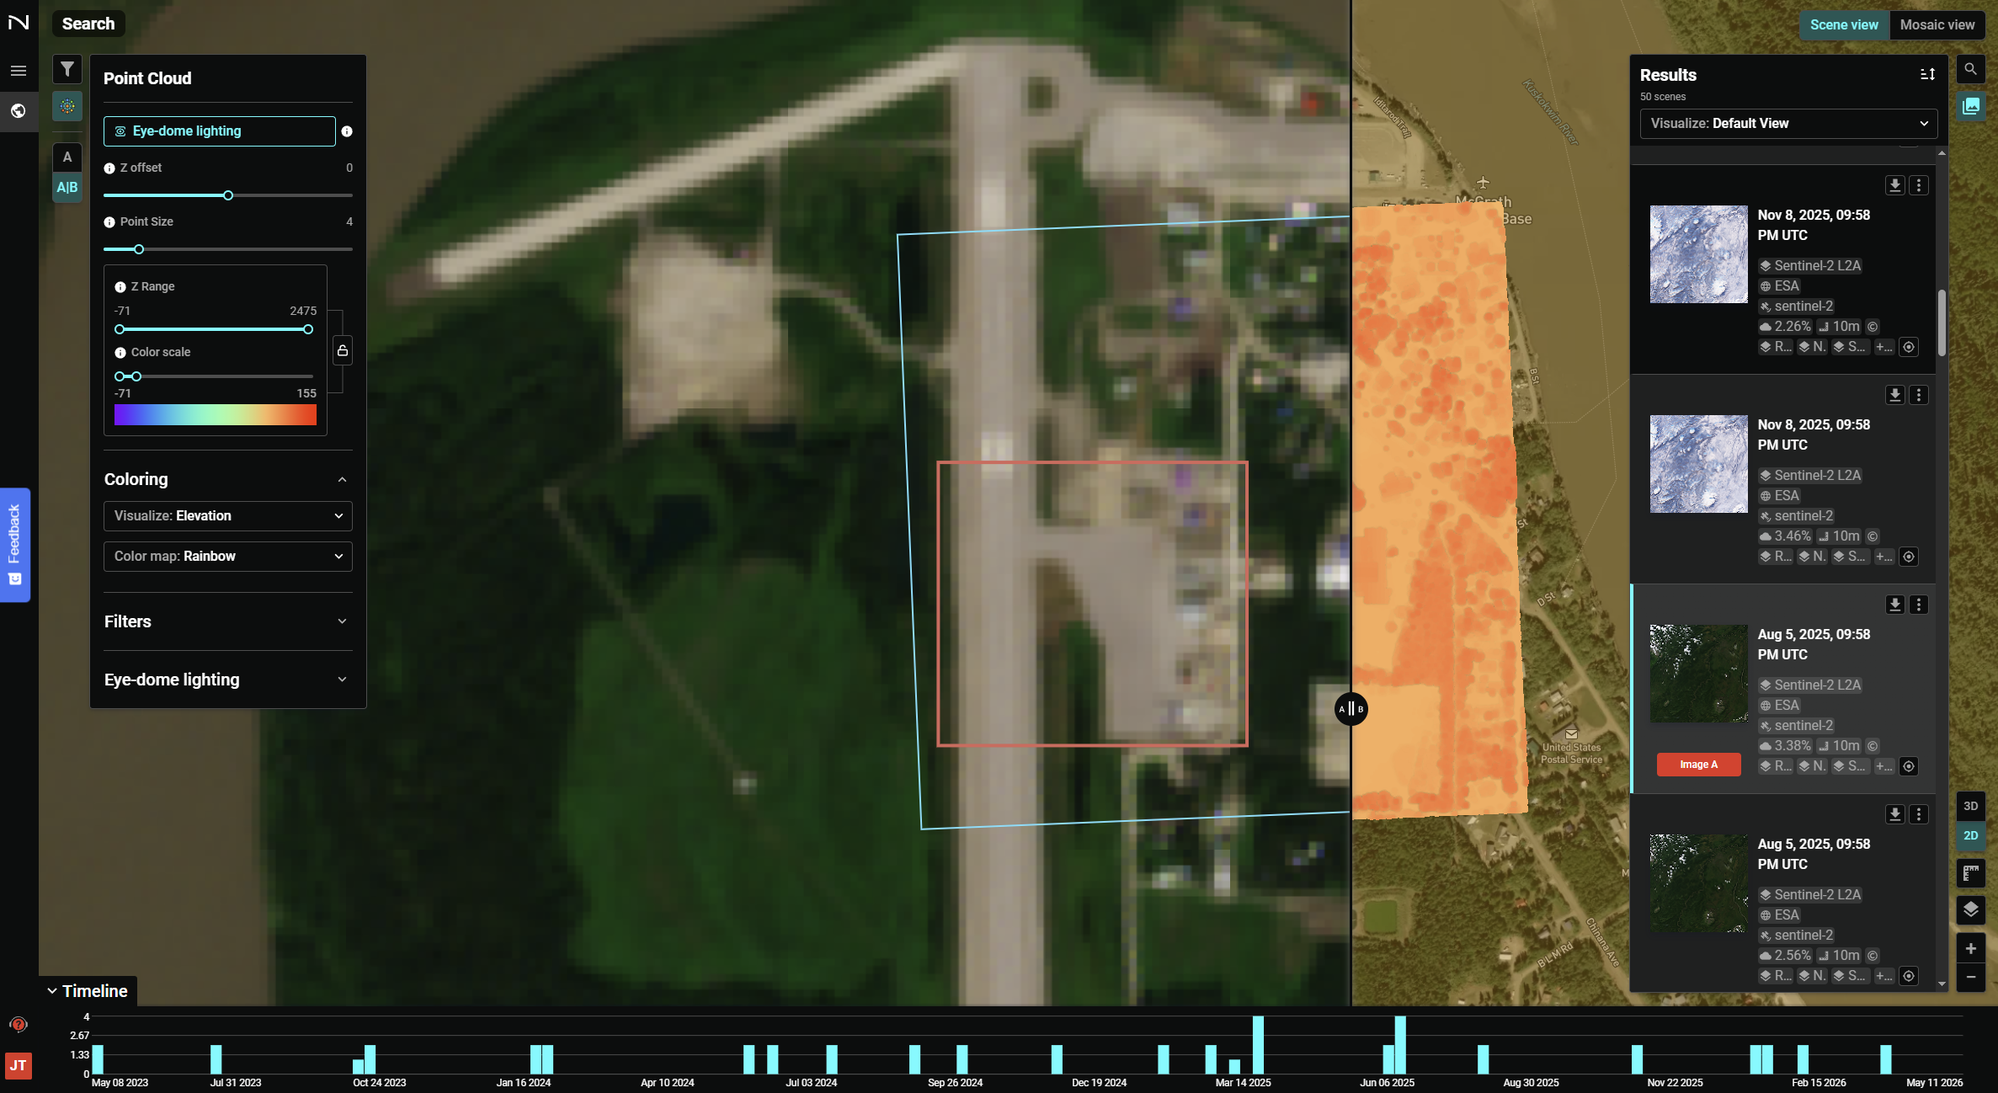
This makes it possible to directly correlate what appears on the ground in optical imagery against the detailed terrain structure captured by LiDAR — useful for:
- Detecting vegetation change between collection dates
- Comparing pre- and post-disturbance ground surfaces
- Validating LiDAR-derived terrain against current imagery
- Infrastructure corridor planning
When Image B is a LiDAR dataset, the Point Cloud settings panel remains active so you can adjust visualization (elevation, classification, color ramp) while the slider is in use.
Returning to Single Image View
Click the A toggle to return to single image mode.