Draw your first site
Sites are the specific locations you want to monitor and analyze within a project. After creating a project, your next step is to add a site.
For information about uploading site boundaries from a file, see Upload a site.
Draw a Site Manually
Open your project. In the left panel, you'll see a Sites list with two options at the bottom: Upload sites and Draw site.
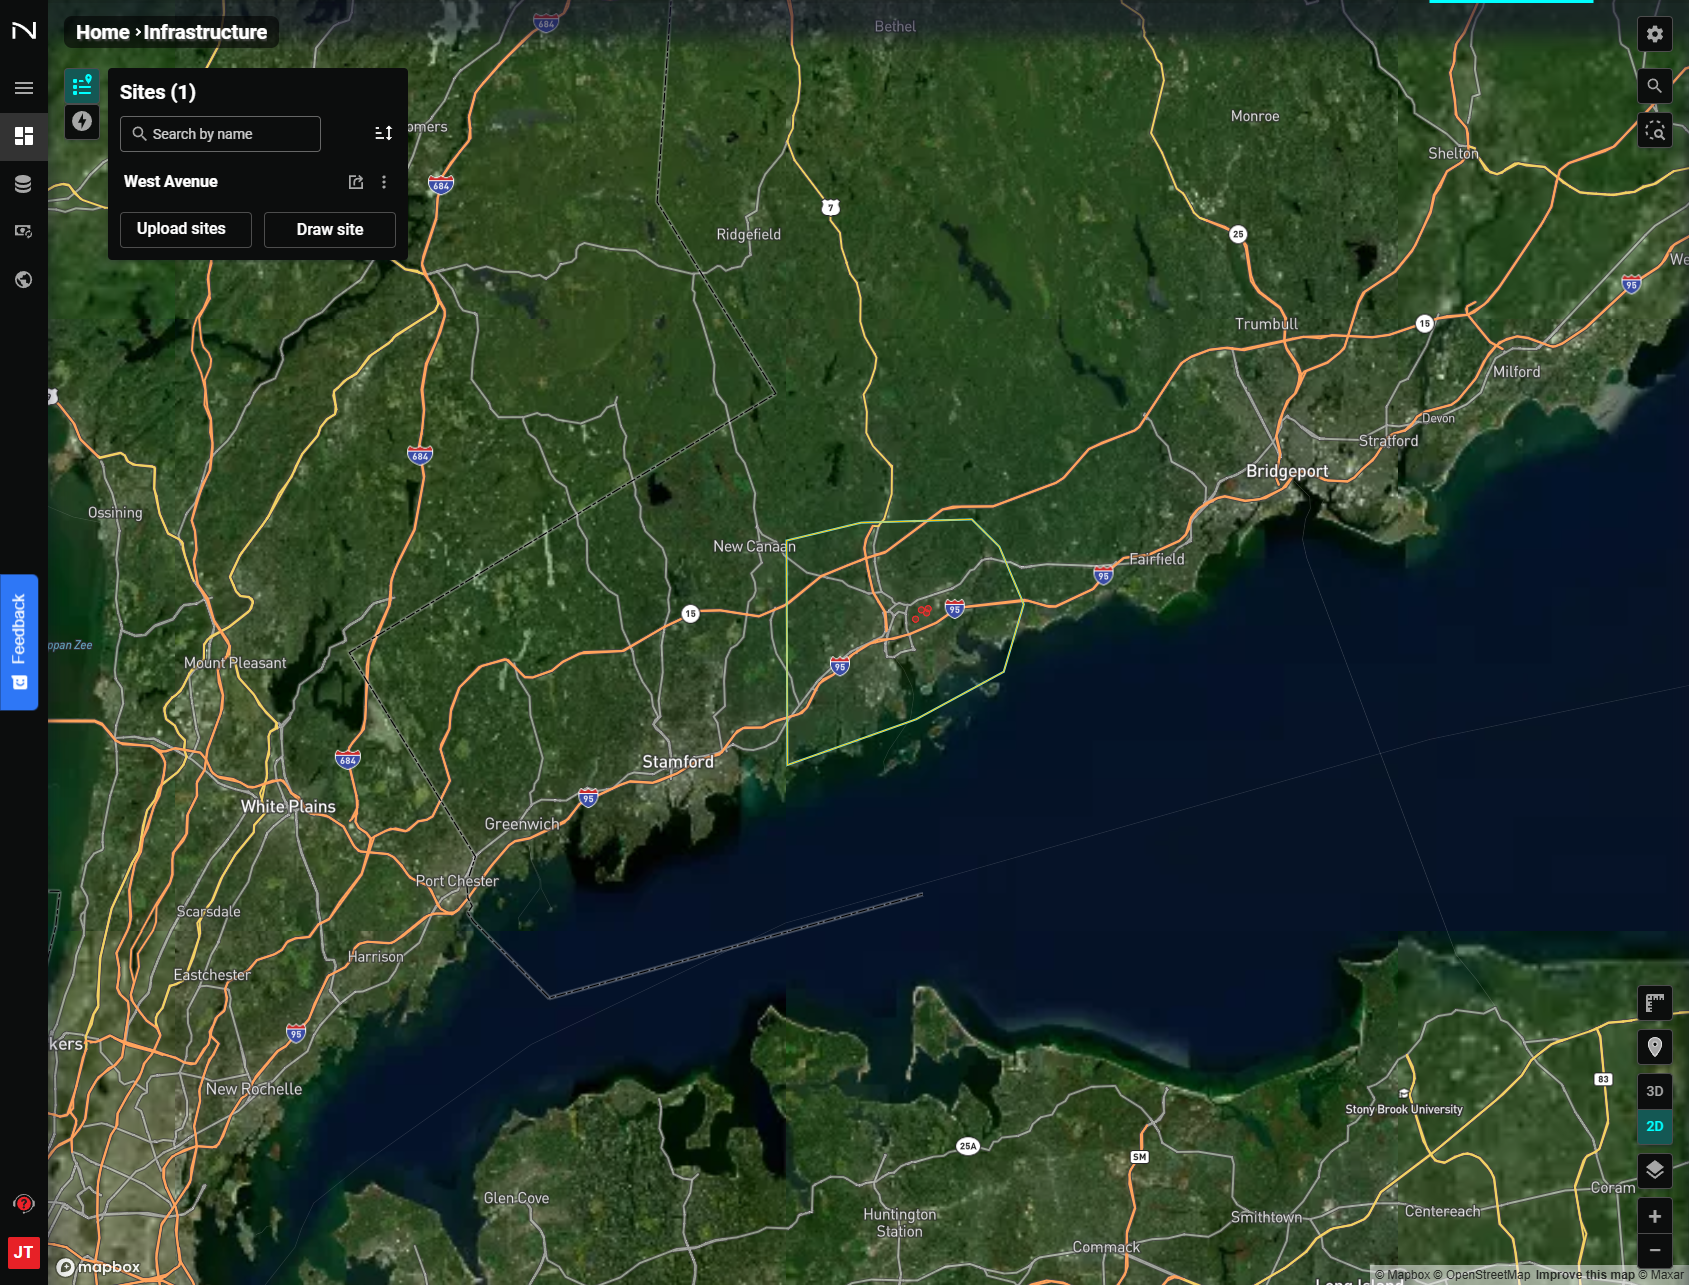
Click Draw site to activate the drawing cursor.
Steps to draw a site:
- Left-click on the map to place the first vertex of your polygon.
- Continue moving the cursor and left-clicking to add more vertices.
- Double-click to place the final vertex and close the polygon.
The NUVIEW Platform will complete the polygon, assign a site name automatically based on any relevant points of interest within the site boundary, and zoom in to your new site.
You can edit your site name anytime by navigating to the project, clicking the stacked dots next to the site you would like to edit, and selecting "Edit name".
Exploring a Site
Once a site is open, the left panel shows tabs for Site Info, Updates, Map Notes, and Visualization.
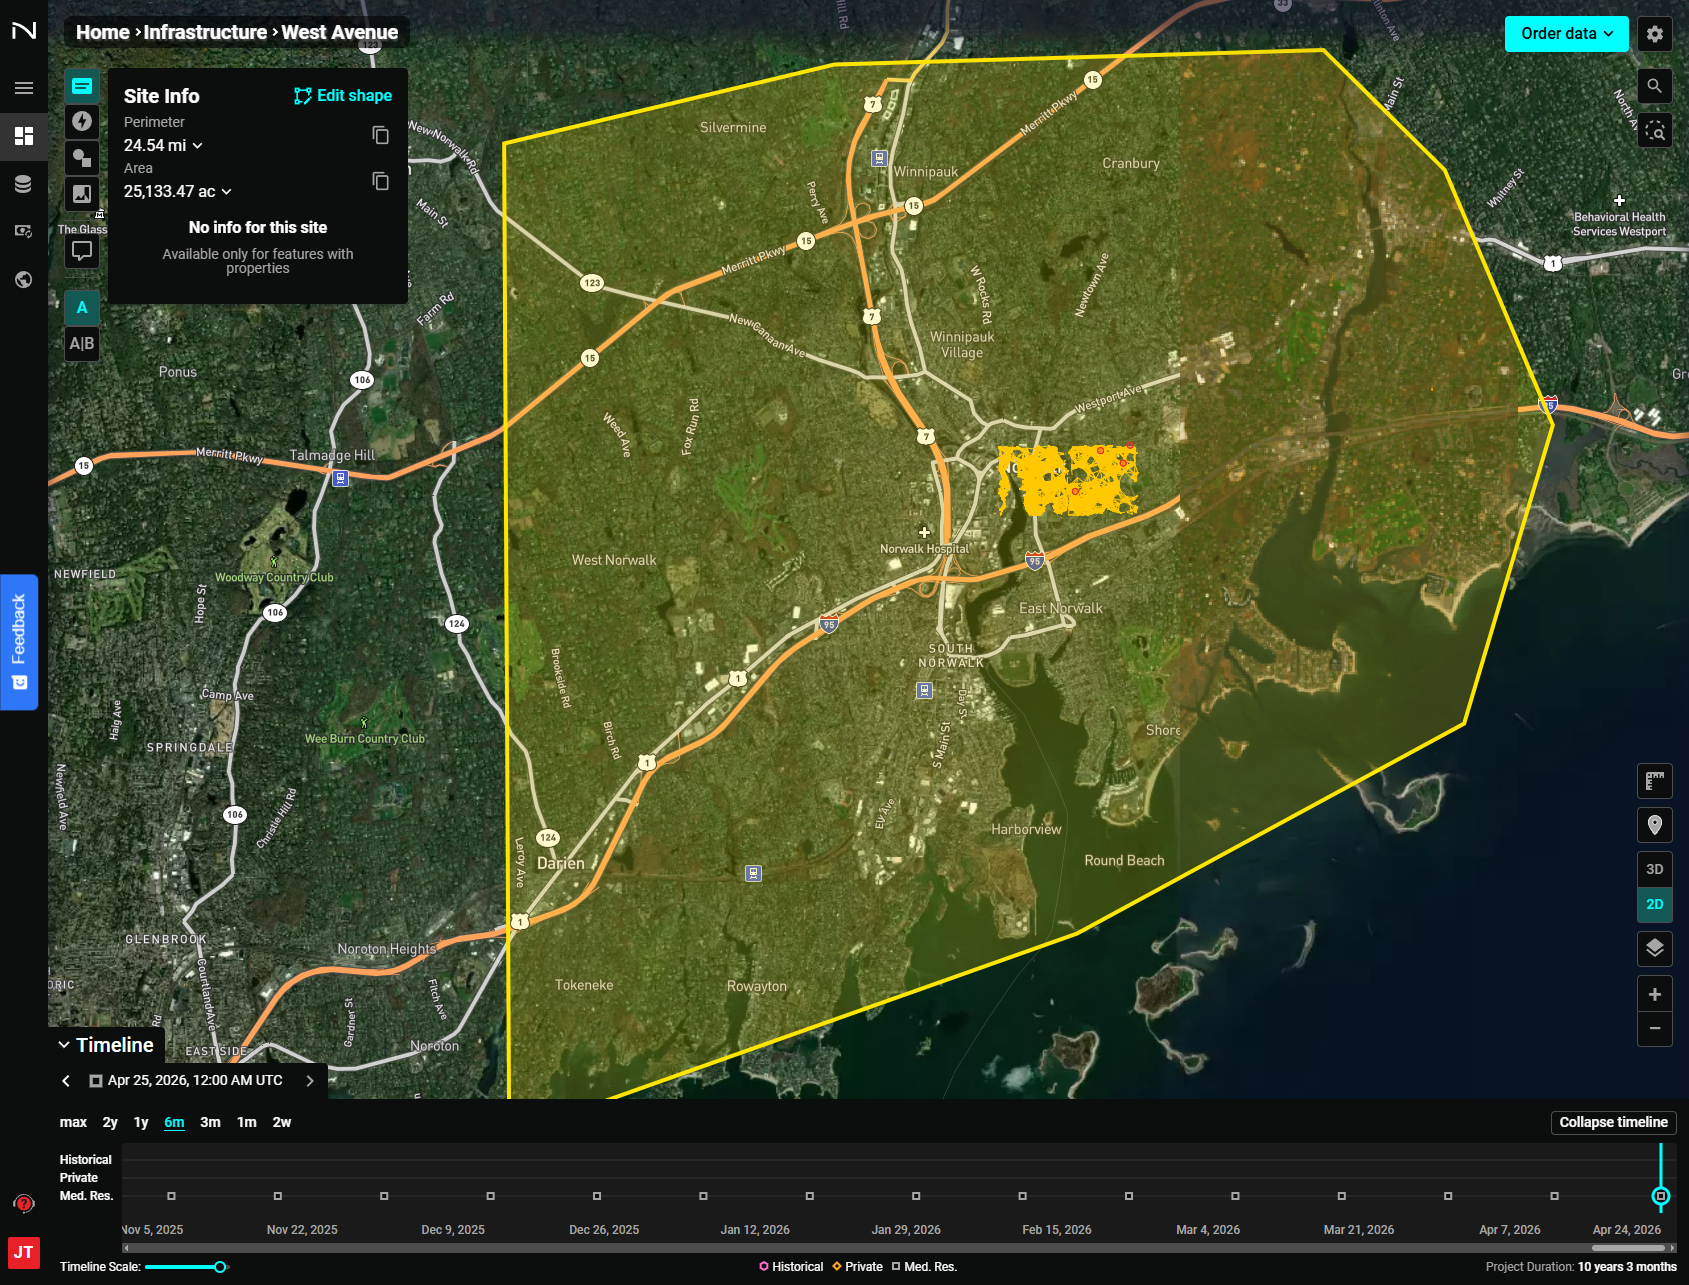
Site Info
The Site Info tab (selected by default) shows the site's perimeter and area. If your site was uploaded with feature properties, those properties also appear here.
Updates
Click the Updates tab to see a list of all changes to the site since it was created. Each entry shows the update name, description, creation date, imagery date, and visualization type. Click any update to zoom directly to it on the map.
Map Notes
Click the Map Notes tab to view and add map notes — annotations tied to specific locations within your site. To add a map note:
- Select a drawing shape (point, rectangle, or polygon).
- Click on the map to draw the note.
- Fill in a name, description, style, and timeline information.
- Click Confirm map note.
Visualization
Click the Visualization tab to change how imagery is rendered. Options include standard true-color, NDVI, EVI2, False Color (Urban), and others depending on your account permissions.
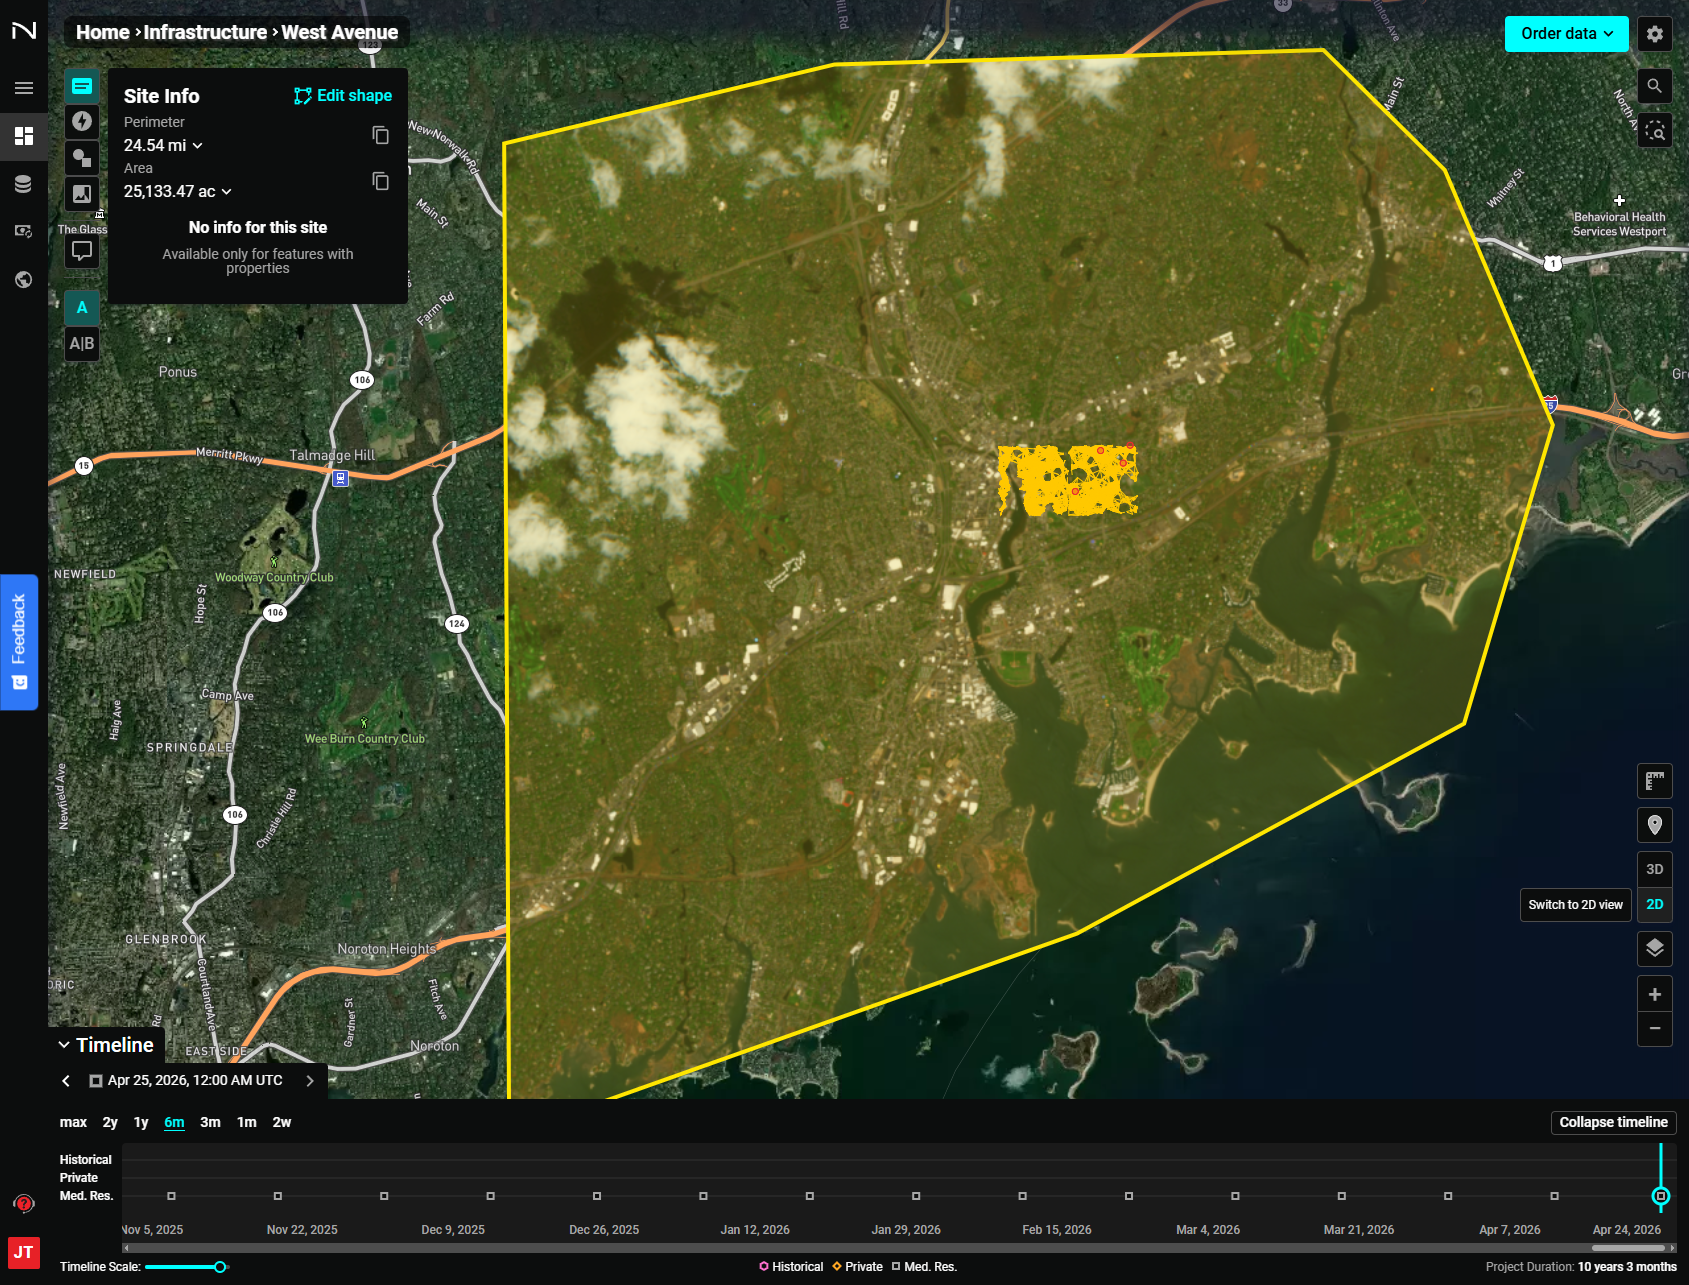
Use the Buffer slider to adjust the area surrounding the site that is included in the rendering.
Adding a Comment
Click Add comment in the left panel header to activate comment mode. Click a location on the map, type your comment, and click Send. Comments are visible to all teammates and are linked to the imagery date at the time they were created.
Side-by-Side Comparison
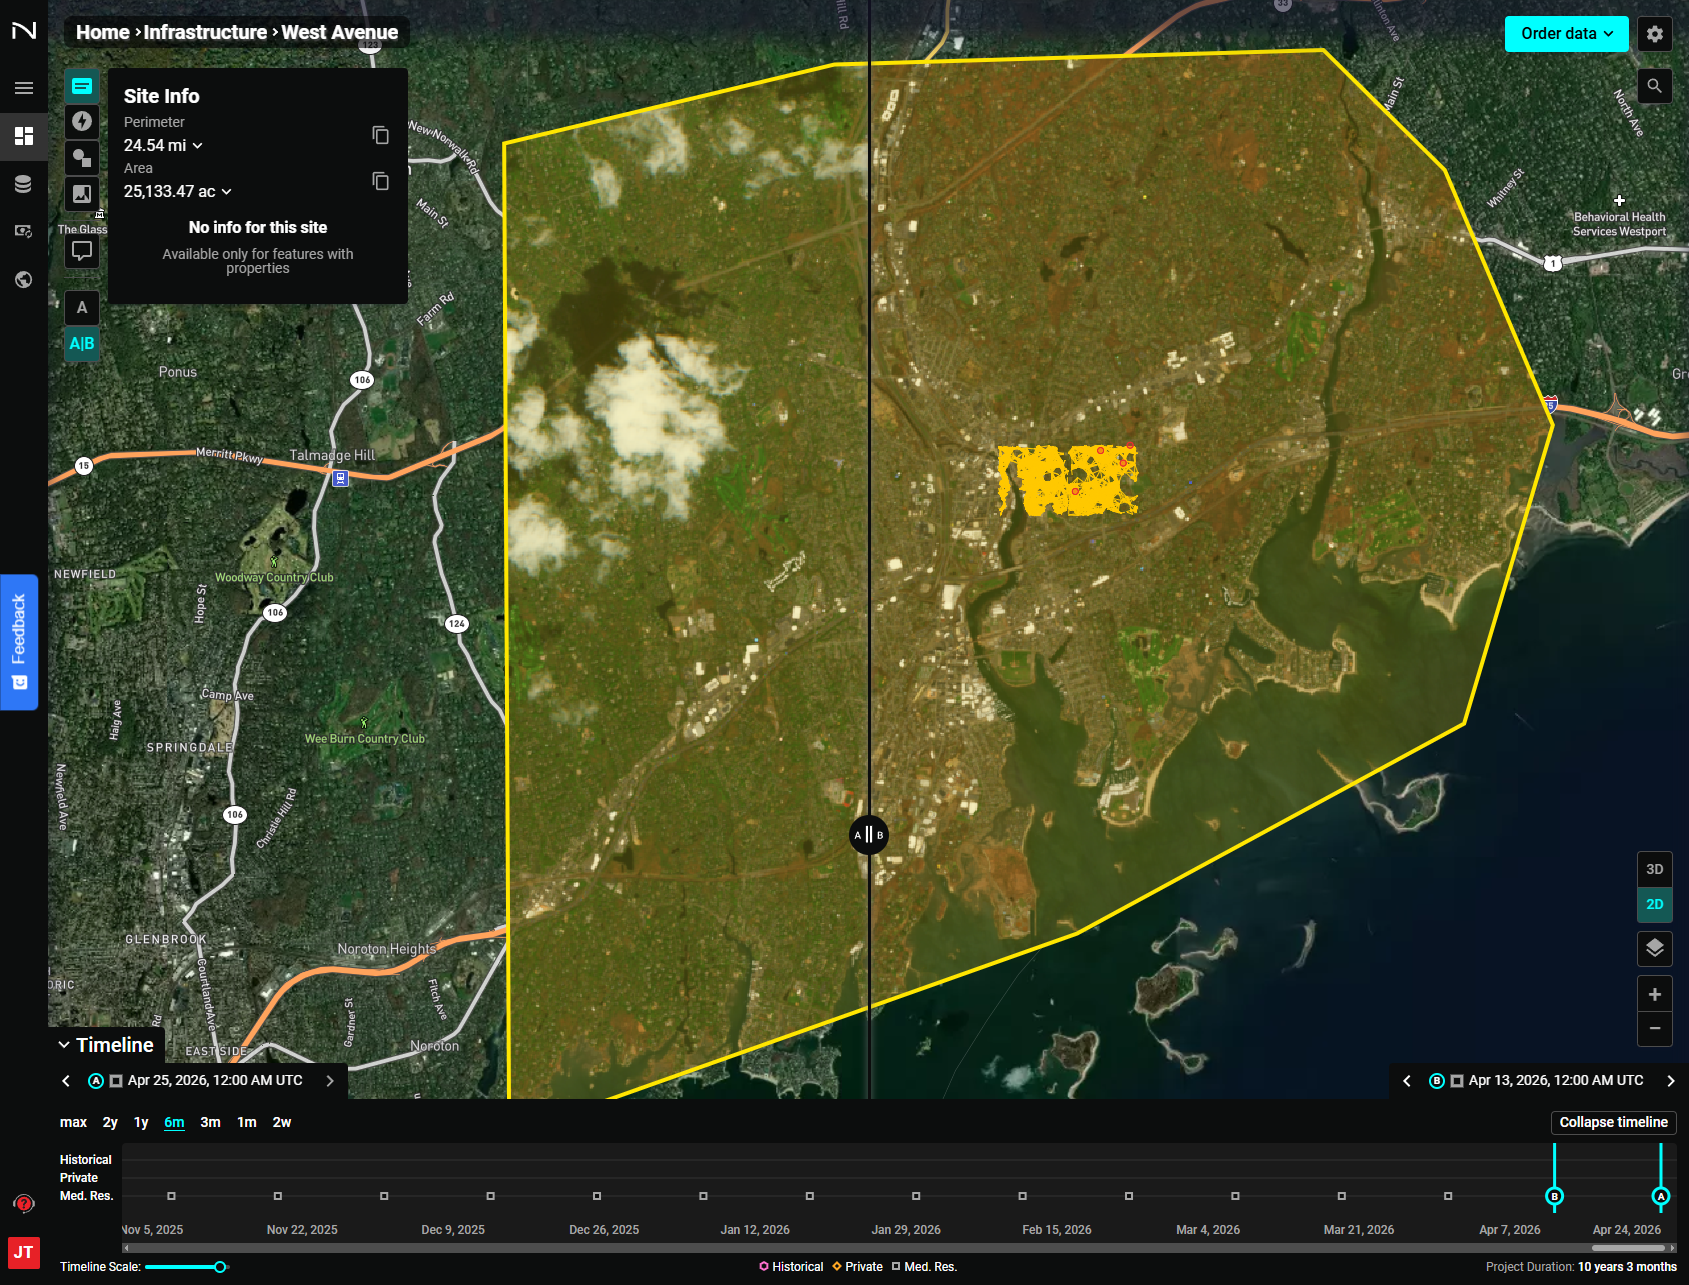
To compare two dates or types of imagery click the A|B toggle in the left panel. Drag and drop the "A" and "B" markers to the imagery you would like to compare. Or, click the arrows for the "A" and "B" markers on the top left and right of the timeline, respectively, to toggle imagery from different dates.
Using the Timeline
When viewing a Monitoring project, the Timeline appears at the bottom of the screen. Use it to browse available imagery over time.
You can return to the default basemap imagery anytime by selecting the "Layers" icon on the left side of the screen and deselecting "Imagery" layers.
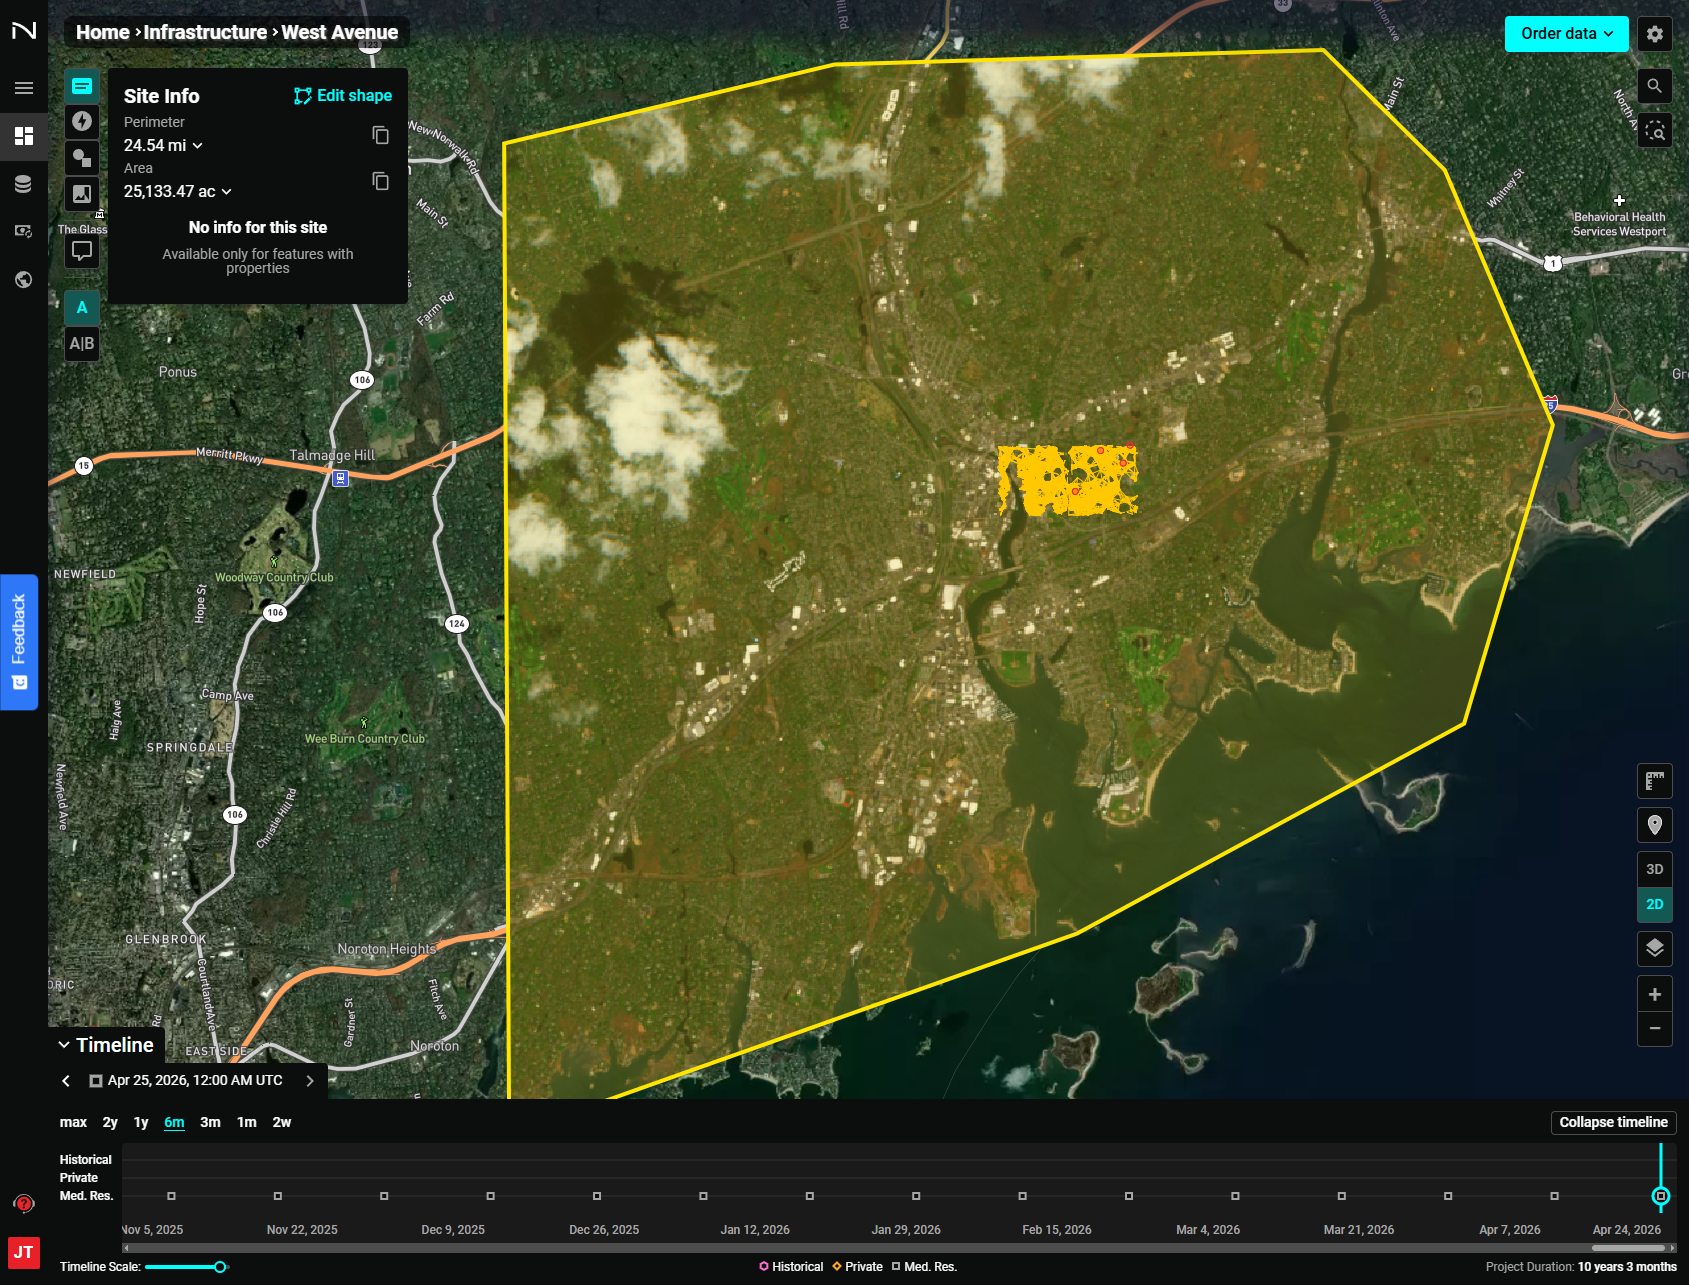
- Use the date range toggles (1m, 3m, 6m, 1y, 2y, max) to adjust how much history is shown.
- Click a point on the timeline to jump to imagery from that date.
- The legend below the timeline shows which imagery sources are available (Historical, Private, Med. Res., etc.).
If the imagery you are looking for does not appear on the timeline, it may be outside the project date range.
- Adjust the project date range by selecting the "Edit Project Configuration" gear icon in the top right and editing the date range.
- Save changes and select "Complete".