Draw a site
Sites are your descrete areas of interest within the NUVIEW Platform. After creating a project, your next step is to add one or more sites. This page covers how to manually draw a site on the map, and how to use the site features available once the site is open.
For information on uploading sites from a file, see Upload a site.
- Draw a Site Manually
- Viewing Site Info
- Adding Map Notes to a Site
- View Updates in a Site
- Changing Visualizations within a Site
- Adding Comments to a Site
Draw a Site Manually
Open a project. In the left panel, you will see a Sites list with two options at the bottom: Upload sites and Draw site.
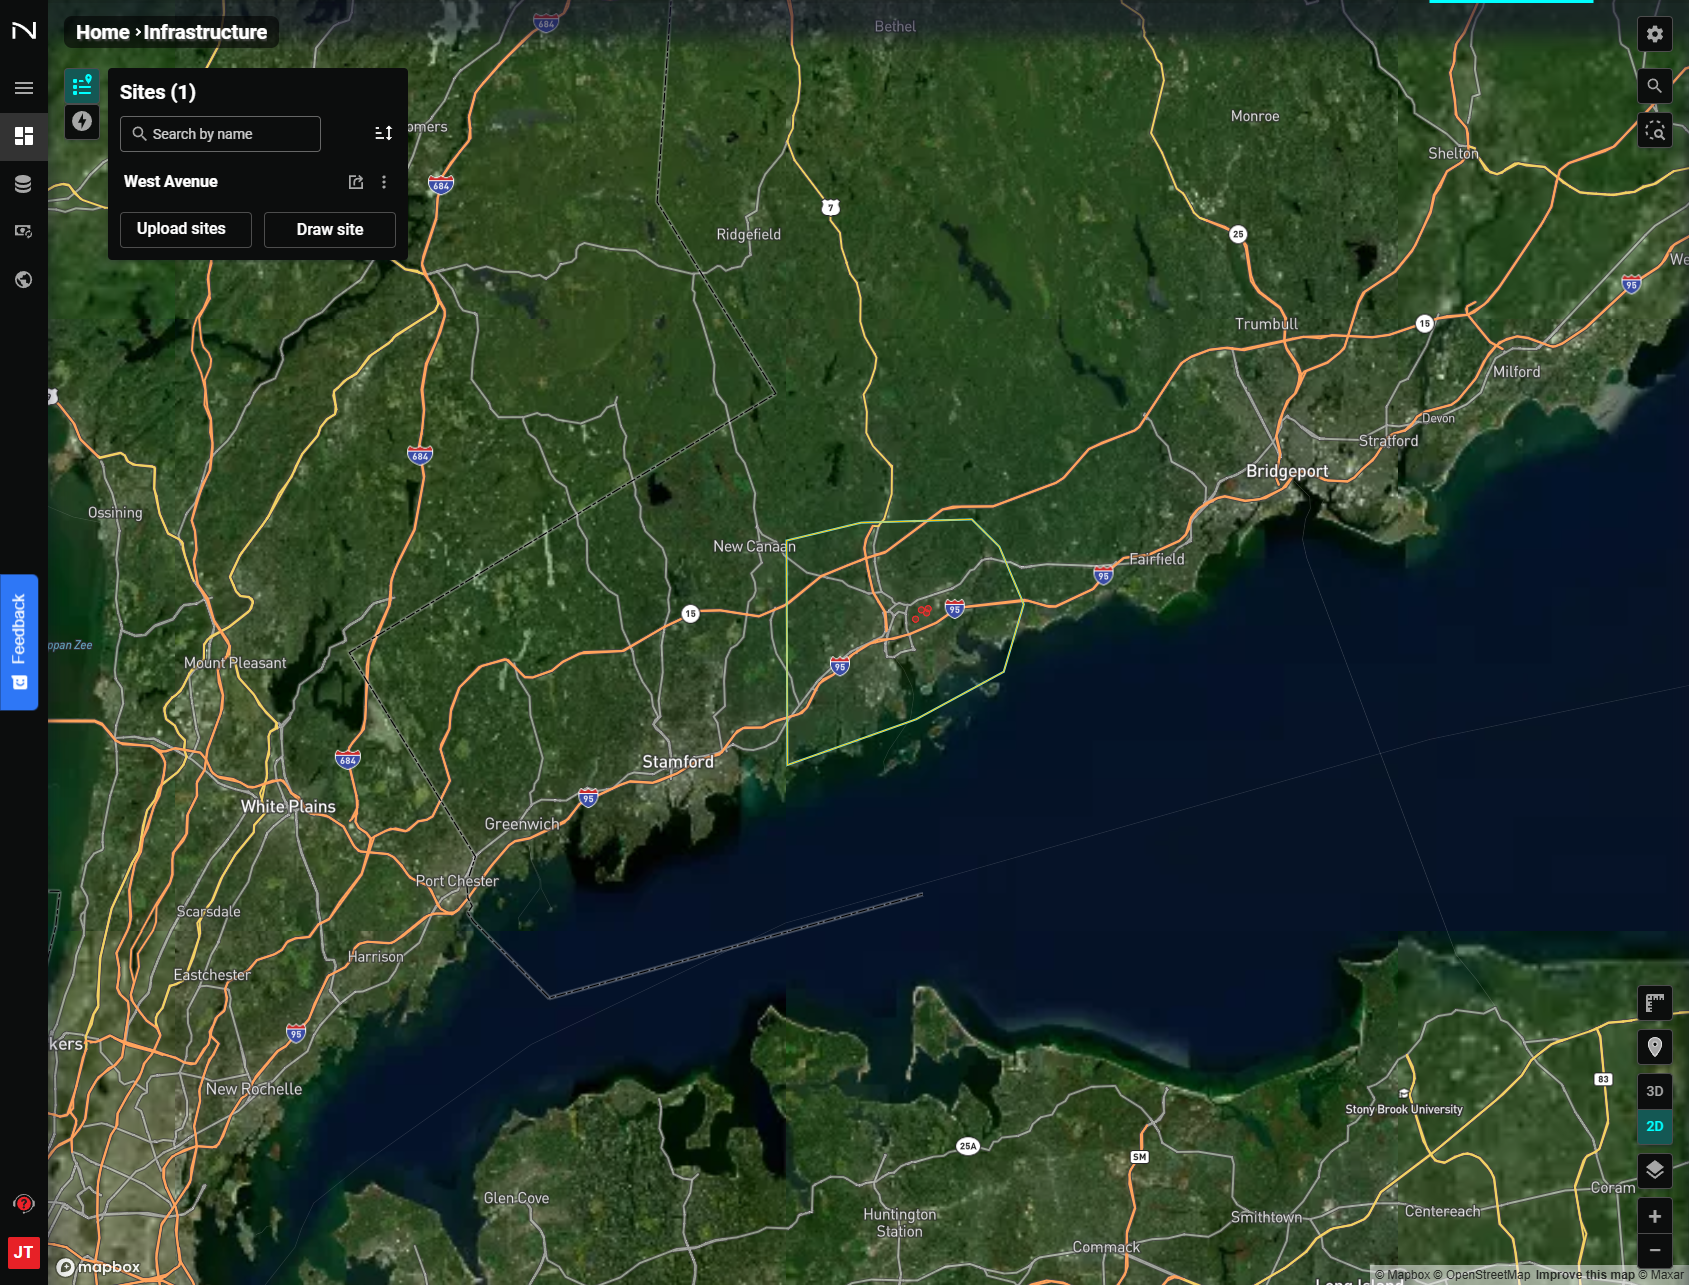
Click Draw site to activate the drawing cursor. The cursor will change to indicate drawing mode is active.
Steps to draw a site:
- Left-click on the map to place the first vertex of the polygon.
- Continue moving the cursor and left-clicking to place additional vertices.
- Double-click to place the final vertex and close the polygon.
The NUVIEW Platform will complete the polygon, assign a name to the site based the nearest road or county, and zoom in to your new site. You can edit the site name any time by clicking the stacked dots next to the site within the project's site list view.
Viewing Site Info
Once inside a site, click the Site Info tab in the left panel (it is selected by default).
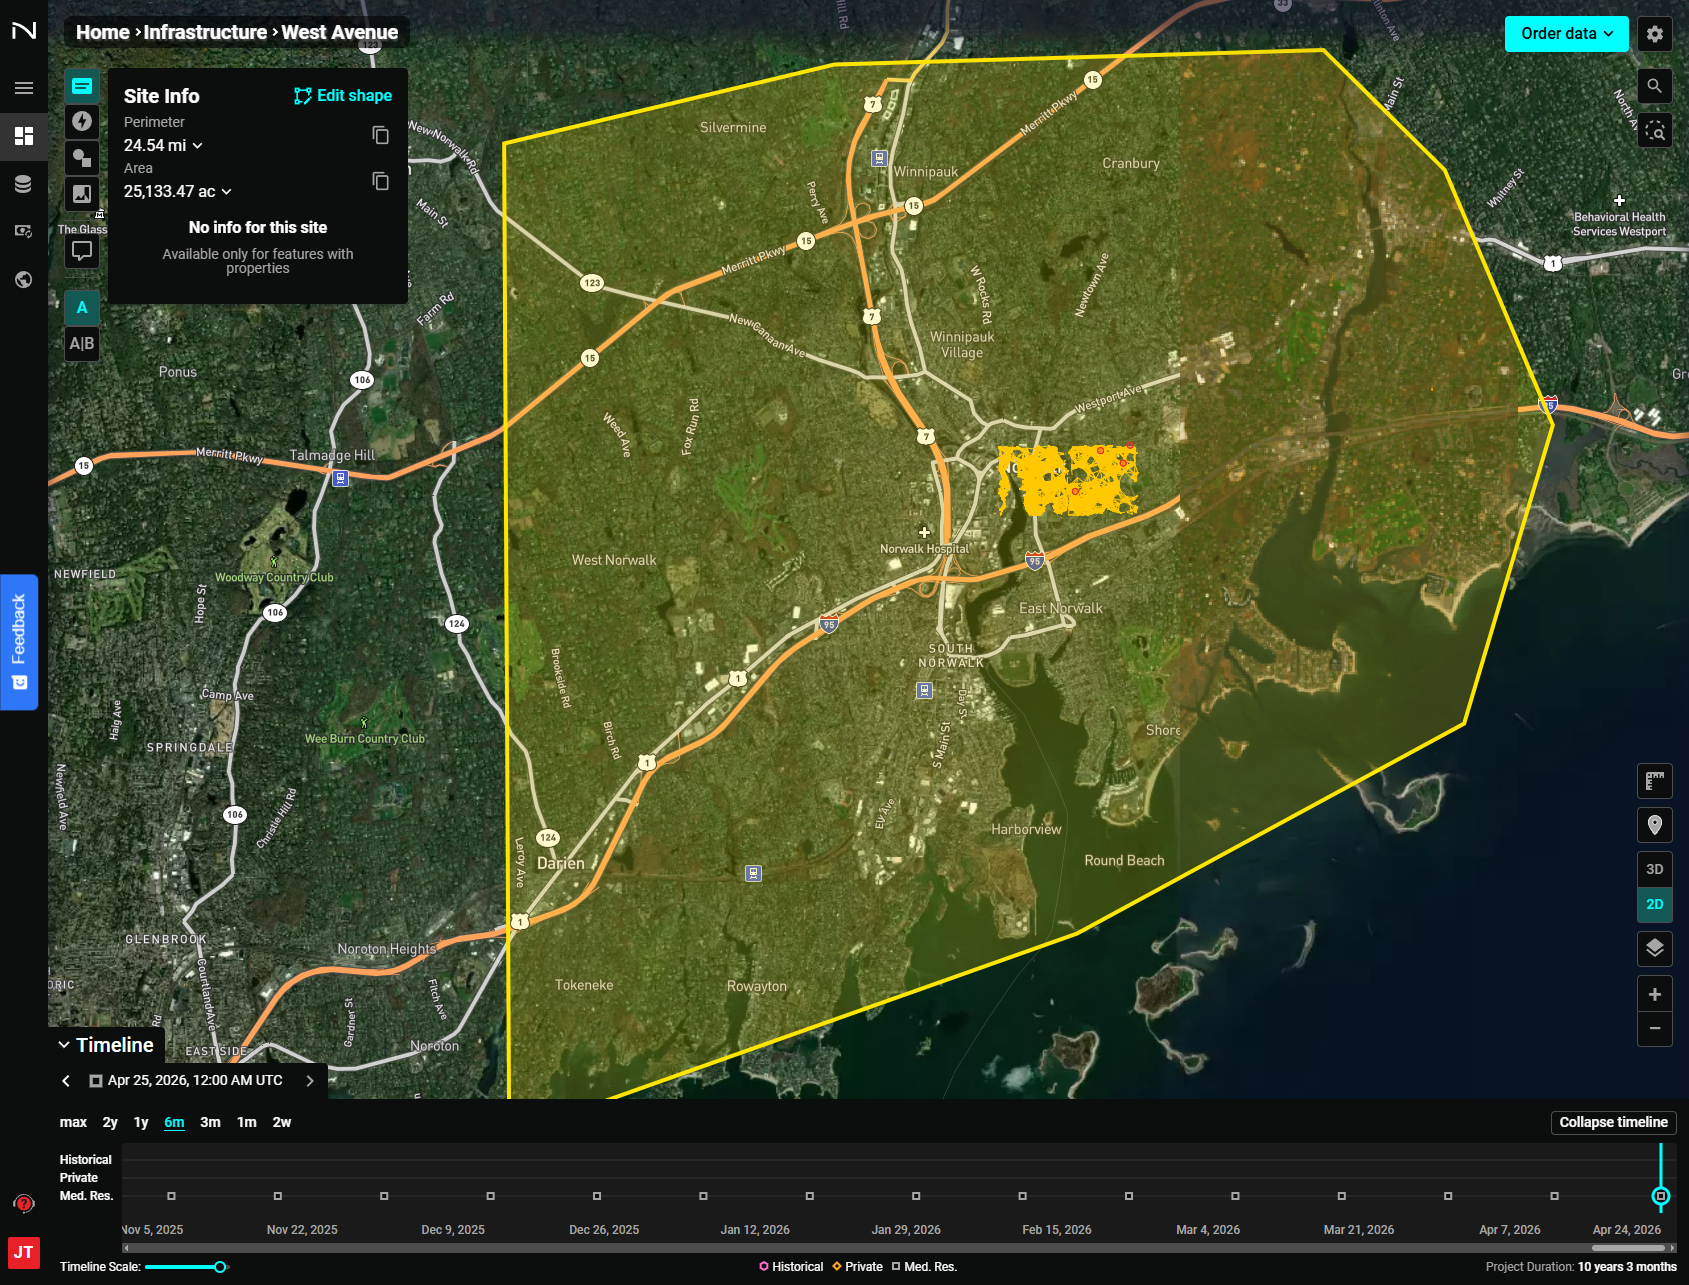
The Site Info panel shows the site's Perimeter and Area. For manually drawn sites, it will display "No info for this site — Available only for features with properties."
Additional properties will appear when data containing feature attributes is added via Data Management or the Add Layers functionality within the "Layers" section of the "Edit Project Configuration" panel.
Adding Map Notes to a Site
Map notes allow you to add annotations to your project sites to call out specific points of interest, features, or other relevant details.
They can be tied to a specific date, appearing only on imagery from that date, or to a data interval so they are visible across imagery within the selected date range.
View Map Notes
Click the Map Notes tab to open the Map Notes panel. Existing map notes are listed here. Click the arrow next to any map note to expand its description.
Draw a Map Note
To add a new map note, select one of the drawing shapes (point, rectangle, or polygon) and click on the map. For example, to draw a rectangular map note:
- Click the rectangle icon.
- Left-click to place the first corner.
- Left-click again to complete the rectangle.
Fill in Map Note Details
Once drawn, fill in a name, description, style, and timeline information for the map note.
Selecting Relative within the map notes Timeline settings will tie the map note to a specific date, meaning the note will only be visible on the map when imagery from that date is selected. The default date is that of the current imagery selection.
To make the note persist across a range of dates and imagery, select Interval and set the date range as desired.
Complete the Map Note
Click Confirm map note to save it.
Adding Comments to a Site
Add a Comment
Click Add comment in the left panel header. Your cursor will update to indicate comment placement mode.
- Click the desired location on the map.
- Write your comment.
- Click Send.
Communicate with Your Team
Comments appear on the map for all teammates, enabling active dialogue directly within the platform.
View Comments
Click a comment bubble on the map to open the full comment thread.
Visualize Imagery at the Time of Creation
When you open a comment thread, the map imagery automatically reverts to what was being viewed when that comment was created — providing full context for the observation.
View Updates in a Site
Click the Updates tab to see a list of all changes to the site notes and comments since it was created.
Each entry shows the map note or comment name, description, creation date, imagery date, and imagery visualization.
Zoom to an Update
Click any update entry to zoom directly to it on the map — making it easy to examine updates without manually panning.
Changing Visualizations within a Site
Click the Visualization tab to change how imagery is rendered over your site.
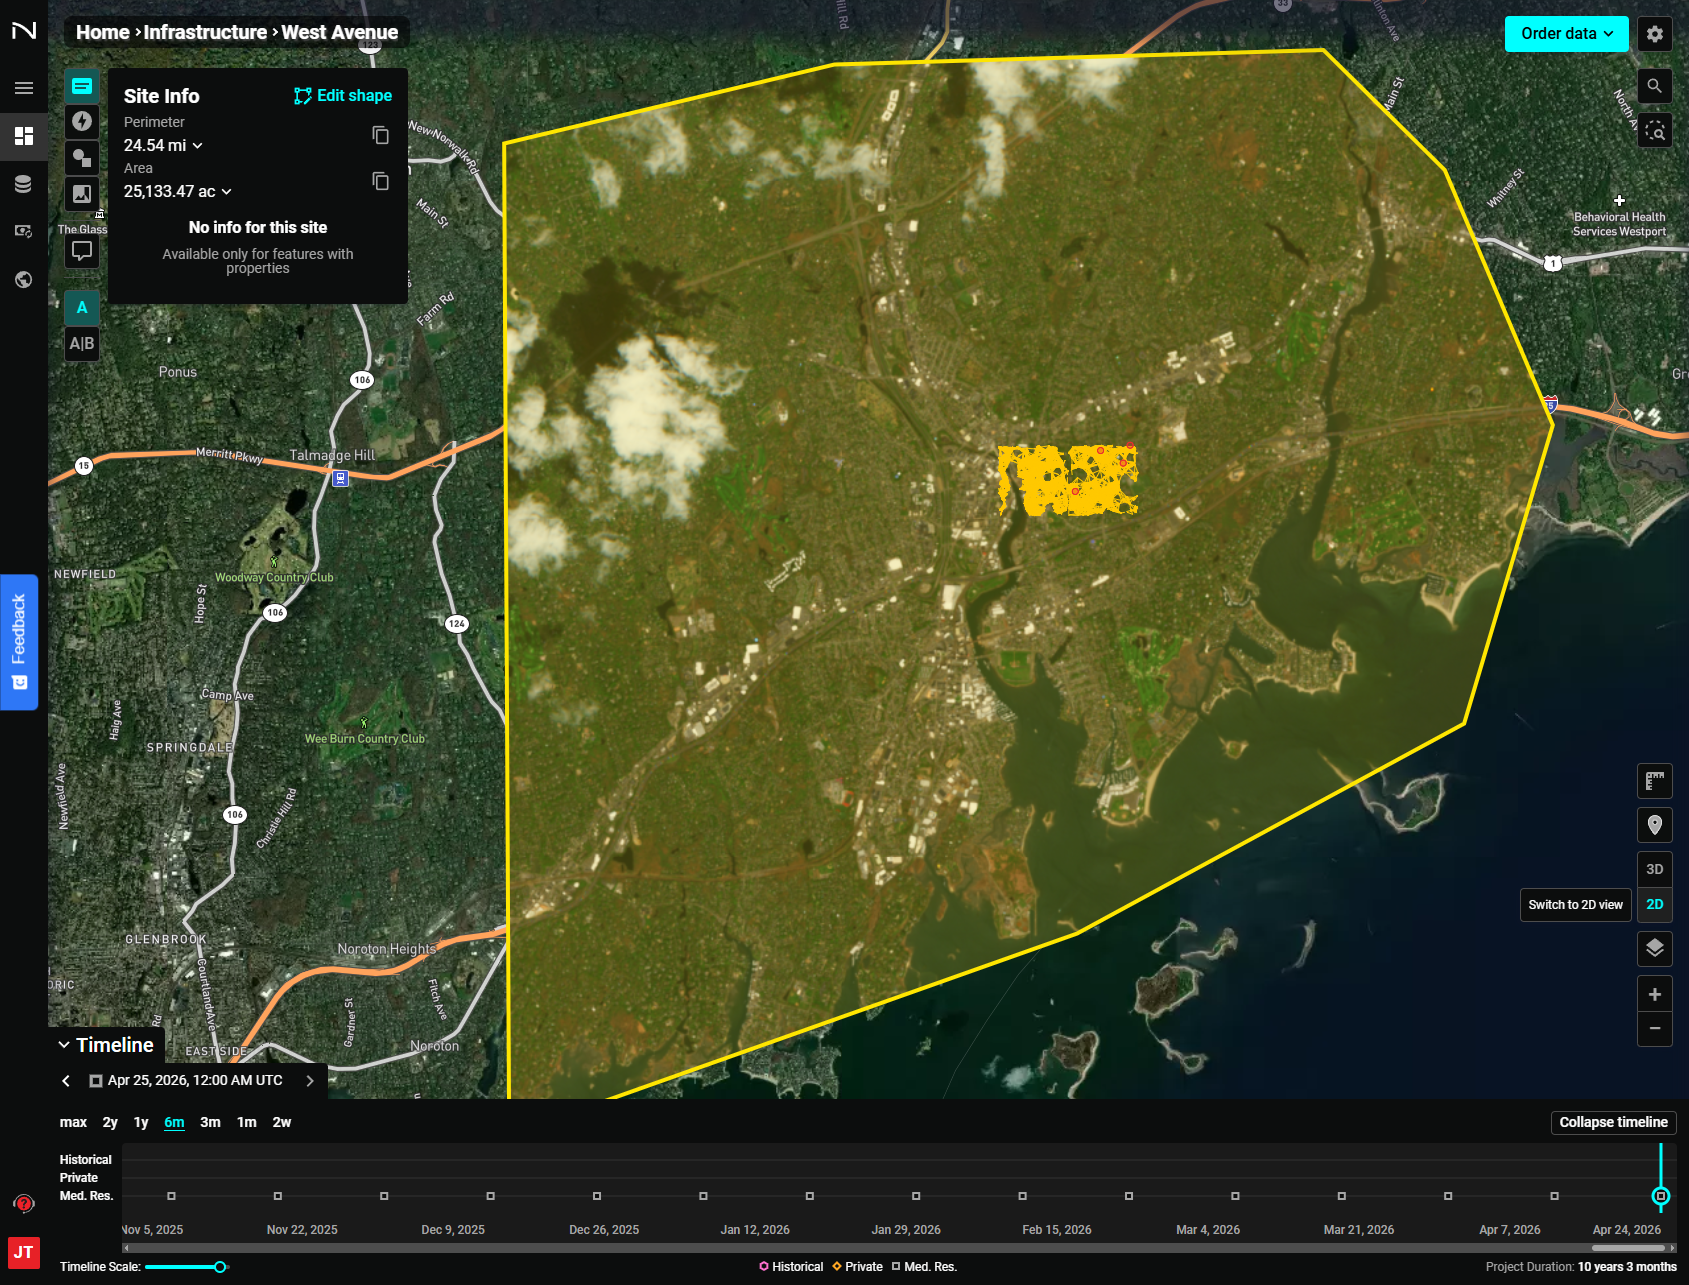
Render Image As
Use the dropdown to change the rendering mode. Available options depend on your account permissions and may include:
- True Color (default)
- NDVI (Normalized Difference Vegetation Index)
- EVI2 (Enhanced Vegetation Index 2)
- False Color (Urban)
Buffer
Use the Buffer slider to expand or contract the area surrounding the site that is included in the imagery rendering.